Posts

Final Project: Hydrologic Effects of Improved Agricultural Practices in The Western Portion of the Ames Fork in the Pecatonica Watershed

Image
Hydrologic Effects of Improved Agricultural Practices in The Western Portion of the Ames Fork in the Pecatonica Watershed Goals The goal of this project is to determine if a similar trend of narrowing Bankfull Width in the headwater reaches, and slight widening in the downstream reaches of watersheds has continued in Southwestern Wisconsin, Specifically in the Western Ames Fork of the Pecatonica River Watershed (Figure 1). In the mid 1930s the SCS soil conservation services implemented improved agricultural practices in an effort to protect the land and try to revert land back to presettlement times where streams were healthy in Wisconsin. I previously did similar research in the Galena River watershed (Figure 2), where data from 2017 was compared to data found in literature that compared linear regression lines from 1940 to 1979. In 2017 myself and a few other students from Missouri State performed field work in the Galena Watershed, where lead and zinc was being traced through ...
Lab 5

Image
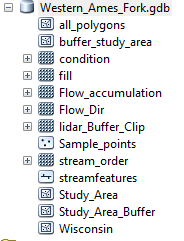
Goal The goal of this Lab is to produce a geodatabase that will be utilized in the Final Project. Methods The process for creating the geodatabase is fairly simple for my project. The data base contains data for the western fork of the Pecatonica river watershed in the western fork of the Ames river.The purpose of the geodatabase is to contain all useful outputs when running a model for watershed delineation and stream delineation, and it will also contain point and polygon feature datasets which contain digitized information. Someone would be able to use this geodatabase to gather watershed areas, there is also data that contains Bankfull widths of streams. The data could be useful in a later study to see if Agricultural affects do affect stream systems in western Wisconsin. The Geodatabase is projected to NAD_1983_UTM_Zone_15N, this is the transvers4e Mercator projection for this sliver of western Wisconsin. No topology or annotations were included. Meta data will contain Lidar i...

Lab 6: Model Builder

Image
Goal In this lab a spatial model of site suitability for corn cultivation will be produced. The factors that are taken into consideration for a suitable corn cultivation site, are land use, slope, and soil drainage. The factors will be given a ranked scale from 1 through 5, with 1 being unsuitable, and 5 being excellent. A weight will be applied to each factor according to its importance. Methods Land use slope and soils were brought into model maker. Each of these inputs was brought into a feature to Raster tool. which converted each input into a raster file. Then each raster was reclassified, the parameters in table 1 were used to rank the land use raster. Table 2's parameters were input to rank the slope raster. and finally table three was used to rank the soils raster. Finally a weighted overlay was done between all three outputs, to produce the weighted overlay which was then transformed into a suitability map to show suitable areas for corn cultivation. The full model is...

Lab 4: Pedestrian Networks at UWEC

Image
Goal The goal of this lab is to perform the whole process of network analysis. First a network dataset will be created to solve a real-world network problem. Specifically we will be exploring the Garfield Avenue construction project on the University of Wisconsin Eau Claire campus where pedestrian traffic has been affected by the closing off of parts of the campus. Two routes will be tested in this lab: the route pedestrians were forced to take in the fall of 2017 due to the construction, then the route available in spring 2018. Question: What is the difference between the two routes in terms of distance and time? Were pedestrians losing time on their commute due to the construction, and if so, how much? Methods The first step was to create a network dataset in ArcMap, with the geodatabase containing the UWEC paths barriers, and stops. In the new network table window, UWEC-paths were selected, then the option to model turns was also turned on. In the evaluators tab, t...

Lab 3: Watershed Analysis

Image
Lab 3: Watershed Analysis Goal Watersheds are land surface areas, that drain water to one specific location, a group of streams that all lead to one place, would all have the same watershed.The goal of this lab is to delineate watersheds utilizing watershed analysis tools, from a DEM raster image. In this lab, Adirondack Park in New York is the site for attempting to delineate watersheds.  Methods To begin the lab, an Adirondack Park boundary shapefile was obtained, from the New York State GIS Clearinghouse.  Additionally a hydrology shapefile from Cornell Universities Geospatial Information Repository (CUGIR), and a #0_arc_second DEM of North America from ArcGIS online was utilized. In order to determine watersheds, the obtained data needs to be processed. I began by creating a buffer around the park boundary in order to allow for a little more room around the park boundary, that way extra raster values can be included so more raster calculations can be performe...

LAB 2: Georeferencing and Data Creation

Image
LAB 2: Georeferencing and Data Creation Goal and Background The goal of lab two is to understand how to properly georeference data that does not contain a spacial reference. Additionally, new data will be created to help solve spatial questions. To apply these skills, the goal is to utilize a map of Eau Claire Wisconsin from 1878, and give it a spatial reference, and extract water feature areas from this data, and compare it to the same data just 140 years later in 2018. Methods The first portion of this lab is to understand what needs to be done to get to the end goal which is to analyze water feature area. In part one the goal is to georeference the 1878 map of Eau Claire Wisconsin (Figure 1). This process is done through the use of the georeferencing toolbar in ArcMap where the image of the map can be moved and shaped to attempt to align it with  the Eau Claire area through using a 2018 centerlines shapefile that shows the middle of all the roads in Eau Claire. (Figure 2...

LAB 1

Image
Introduction For this first lab in Geography 337 GIS II, the goal is to review the skill set we have already obtained from completing GIS I. We reviewed different coordinate systems and projections. We also went over ArcCatalog and its different uses, followed by using ArcMap to view and understand different shape files. Finally we created a couple of maps representing our knowledge on symbolizing different variables, and normalizing these variables. Methodology In this lab we were to create two maps from data from Erie County, New York. To begin this process, first the attribute table was looked at, to determine what variables can be represented through this data. Number of persons and Number of households were the two variables i selected. But these variables would be better represented if normalized by an area on the map, therefore i normalized the data by square miles. This gave me the opportunity to look at the data in terms of smaller areas. Once the data was inserted into th...